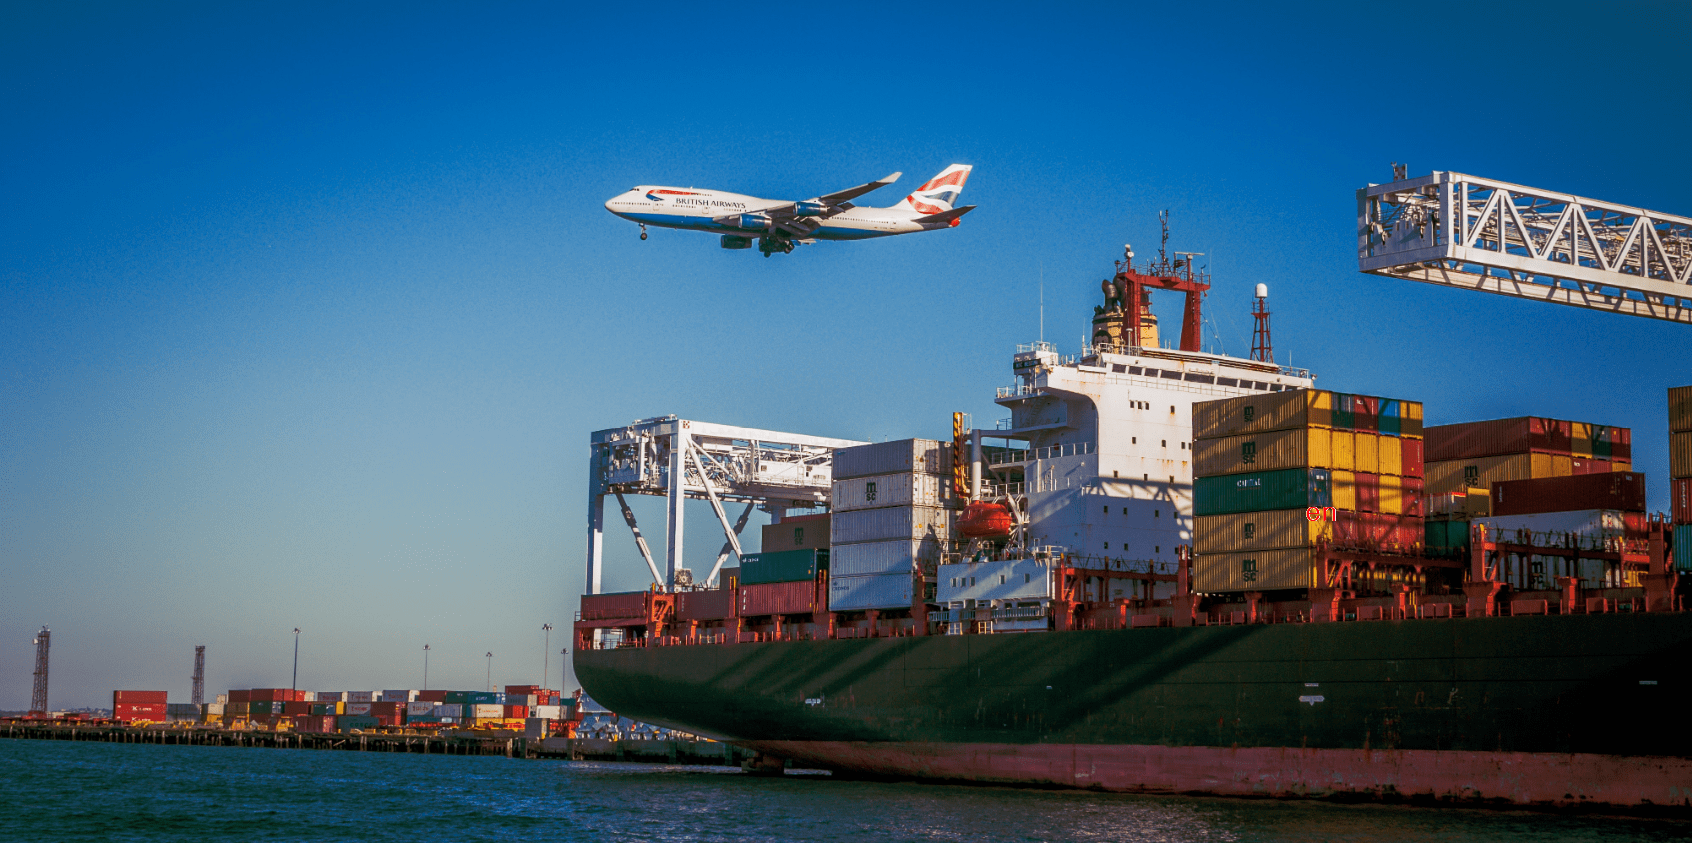
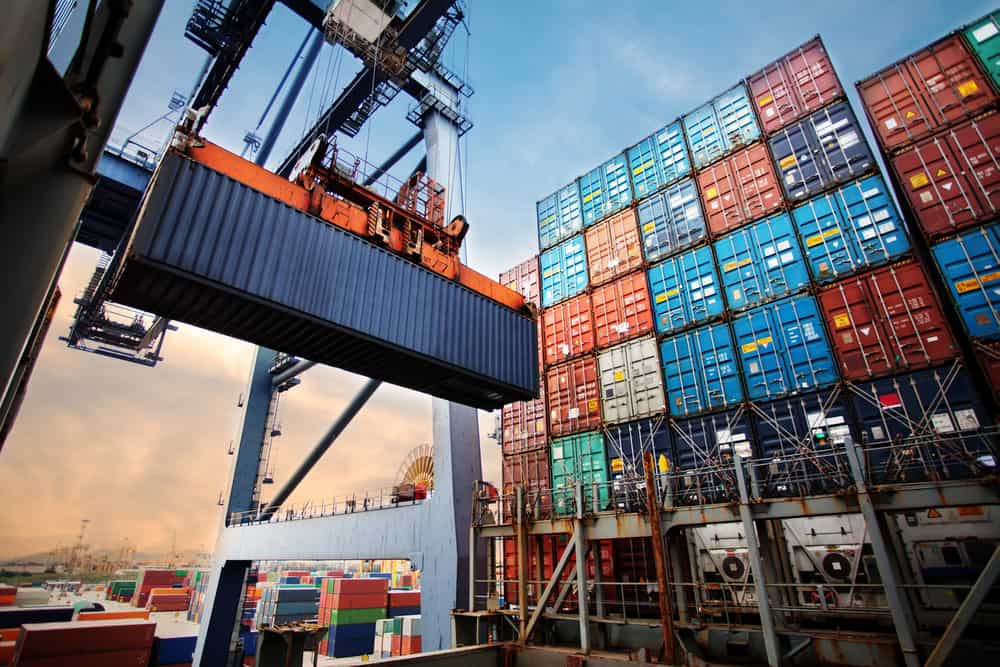
Air Cargo Transportation is entering 2026 with stronger demand, tighter capacity, and higher customer expectations. The International Air Transport Association reported that global air cargo demand increased 11.3% in 2024. Capacity grew more slowly, rising by 7.4%, according to IATA’s 2024 Full-Year Air Cargo Market Analysis. This imbalance has placed greater pressure on carriers, freight forwarders, airports, and ground-handling partners.
The strongest companies are not defined by fleet size alone. They combine reliable schedules, broad intercontinental networks, secure handling, responsive customer service, and accurate shipment visibility. Temperature-sensitive pharmaceuticals need controlled handovers. Electronics require careful screening and fast transfer times. A delayed scan can create more concern than a delayed truck. Boeing’s Commercial Market Outlook for 2024–2043 expects continued long-term cargo growth and expanded freighter requirements. That outlook supports sustained investment in aircraft, hubs, digital systems, and trained personnel.
The 2026 global comparison should consider evidence from IATA market data, Boeing forecasts, annual company reports, and recognized logistics research. Relevant measures include cargo capacity, service coverage, on-time performance, financial resilience, technology adoption, and environmental progress. No ranking is flawless. Public data can differ between companies, regions, and reporting periods. Some local specialists may outperform larger groups on difficult trade lanes. That detail matters.
This overview therefore treats “top” as a balanced judgment, not a simple size contest. It highlights companies with credible operating experience and measurable international capability. Readers should still verify current schedules, handling limits, and service conditions before making commercial decisions. The market moves quickly. Even respected leaders can lose consistency.

2026 Global Air Cargo Metrics: IATA CTKs, ACTKs, Revenue, and Fleet Data
2026 Global Air Cargo Metrics: CTKs, ACTKs, Revenue, and Fleet Data
The 2026 air cargo market should be measured through several connected indicators. Cargo tonne-kilometres, or CTKs, show actual freight demand. Available cargo tonne-kilometres, or ACTKs, show offered capacity. A strong operator usually balances both figures carefully.
When CTKs rise faster than ACTKs, aircraft space becomes tighter. This can support stronger yields and cargo revenue. When ACTKs grow too quickly, load factors may weaken. That difference matters. Revenue figures need similar care. Cargo-only revenue is more useful than total airline revenue because passenger operations can distort comparisons.
Fleet data adds operational context. Analysts should separate active freighters from parked aircraft and passenger aircraft carrying lower-deck cargo. A large fleet does not always mean higher productivity. Aircraft age, utilization, route density, and maintenance planning can change the result. Reliable rankings should compare audited financial reports, traffic releases, and verified fleet registers.
The numbers can still mislead.
Some carriers report cargo revenue differently. Regional accounting practices may also vary. I would review trends across several quarters instead of trusting one impressive figure. A company with moderate CTKs but rising revenue may be improving pricing or network quality. Another company may show rapid capacity growth while producing weaker returns. These details help identify the strongest global air cargo transportation companies in 2026 without treating size as the only measure.
2026 Top Air Cargo Transportation Companies Worldwide?
2026 Global Air Cargo Metrics: IATA CTKs, ACTKs, Revenue, and Fleet Data
This industry-level index uses 2023 as the base year. Global air cargo demand increased by 11.3% in 2024, while available cargo capacity increased by 7.4%, based on published international air transport statistics. Revenue and freighter-fleet figures are rounded global market estimates; 2025–2026 values represent market outlook scenarios rather than company-specific data.
CTKs: Cargo Tonne-Kilometres | ACTKs: Available Cargo Tonne-Kilometres | Index base: 2023 = 100
Ranking Methodology: FTKs, Network Reach, Fleet Size, and Service Reliability
A credible 2026 ranking of global air cargo transportation companies should begin with freight tonne-kilometres, or FTKs. FTKs measure both cargo weight and distance flown, making them more useful than shipment counts. The 2025 World Air Transport Statistics report recorded an 11.3% rise in global air cargo demand during 2024. That growth also exposed uneven capacity across regions. A practical model could assign FTKs 40% of the score.
Network reach deserves 25%. Analysts should count served airports, international gateways, freighter routes, and meaningful weekly frequencies. A large route map can look impressive, but thin schedules may offer little value. Fleet size could receive 20%, using active freighters, payload range, aircraft age, and utilization. The 2024–2043 Commercial Market Outlook projects strong long-term freighter demand, yet aircraft quantity alone remains an imperfect measure of operating strength. More metal does not always mean more lift.
Service reliability should hold the remaining 15%. Useful indicators include on-time departure, schedule completion, cargo acceptance accuracy, damage frequency, and claims resolution time. Independent shipment-performance data should be checked against audited company disclosures. Data gaps matter. Some operators report punctuality differently, while network capacity changes seasonally. A transparent ranking should publish its calculation period and missing-data rules. Otherwise, precise-looking scores may hide weak evidence. Reliability is felt at the warehouse door.
Top Integrators by Scale: DHL, FedEx, UPS, and SF Express
In 2026, the leading air cargo integrators compete through network scale, speed, and dependable delivery control. Four global operators stand out across these measures. Their fleets connect major cargo airports with regional gateways, while integrated sorting hubs reduce handoffs between aircraft and trucks. Scale matters, but it does not guarantee a smooth shipment.
The largest networks combine overnight air services, customs expertise, warehouse systems, and door-to-door tracking. A parcel collected in Seoul may reach a distribution center in Europe within two days. Automated scanners record weight, dimensions, location, and transfer time at several checkpoints. Dedicated cargo aircraft support dense international routes, while passenger aircraft capacity adds flexibility during seasonal peaks. Clear service windows also help manufacturers plan inventory and reduce costly storage.
Still, network size can hide weak points. Weather, airport congestion, labor shortages, and inaccurate shipment data can disrupt carefully planned schedules. From practical logistics reviews, tracking quality often matters as much as aircraft capacity. Customers need useful alerts, not repeated status messages. Service reliability also differs by route and local partner. That detail deserves more attention in industry rankings. My assessment may overlook smaller regional specialists, especially where local knowledge beats global scale. Their performance can be less visible, yet highly effective for time-sensitive business cargo.
Freighter Specialists and Fleet Growth: Atlas Air, Cargolux, and Air Transport World Data
Freighter specialists are reshaping global air cargo through disciplined fleet growth. IATA reported that worldwide air cargo demand rose 11.3% in 2024, while capacity increased 7.4%. That gap improved aircraft utilization and strengthened yields on major trade lanes.
Large dedicated-freighter operators are adding newer aircraft and converting passenger jets. Boeing’s 2024 Commercial Market Outlook projects the global freighter fleet will grow from about 2,340 aircraft to 3,900 by 2043. The forecast also includes approximately 2,435 new and converted freighters. Fleet age matters. Newer aircraft usually offer better fuel efficiency, longer range, and more reliable temperature control.
Operational detail still decides performance. A freighter may wait beside a warehouse while pallets are rebuilt, delayed by weather or airport congestion. Air Transport World fleet data shows that leading cargo groups continue expanding through mixed fleets, leased aircraft, and regional partnerships. This approach improves network flexibility, but it can increase maintenance complexity.
The data is persuasive, not perfect. Forecasts often assume stable trade growth and sufficient pilot capacity. Those assumptions can weaken quickly. Fuel prices, airport slots, and conversion supply remain difficult variables. Operators also need accurate shipment visibility, especially when customers monitor high-value goods across several hubs. Small delays matter. A missed connection can erase the advantage of a larger aircraft.
2026 Top Air Cargo Transportation Companies Worldwide? - Freighter Specialists and Fleet Growth: Atlas Air, Cargolux, and Air Transport World Data
Worldwide air-cargo benchmark dashboard using the latest complete global industry baseline. Company-level names, rankings, and brand-specific operating data are excluded.
| Data Dimension |
Latest Reported Value |
Period / Basis |
Industry Relevance |
| Global air-cargo demand |
+11.3% |
2024 year on year |
Measured in cargo tonne-kilometres; the strongest annual growth in recent market history. |
| Global cargo capacity |
+7.4% |
2024 year on year |
Available cargo tonne-kilometres expanded more slowly than demand, supporting stronger aircraft utilization. |
| Worldwide cargo load factor |
49.4% |
2024 annual average |
Indicates the proportion of available cargo capacity used across the global market. |
| International cargo demand |
+12.2% |
2024 year on year |
Reflects strong cross-border activity in manufacturing, electronics, e-commerce, and time-sensitive logistics. |
| Demand index |
111.3 |
2023 = 100; 2024 value derived from annual growth |
Provides a neutral comparison point for evaluating market expansion without using company-level figures. |
| Capacity index |
107.4 |
2023 = 100; 2024 value derived from annual growth |
Shows that available capacity grew more slowly than demand during the year. |
| Typical main-deck freighter payload |
Approximately 50–140 tonnes |
Representative aircraft-class range |
Supports long-haul movement of dense, oversized, and high-volume cargo. |
| Typical converted narrowbody freighter payload |
Approximately 15–30 tonnes |
Representative aircraft-class range |
Well suited to regional networks, short-haul connectivity, and scheduled parcel distribution. |
| Primary cargo growth segments |
E-commerce, electronics, pharmaceuticals, and perishables |
Current market drivers |
These segments favor speed, reliability, temperature control, and frequent international service. |
| Fleet-growth indicators |
Freighter replacement, conversions, and additional widebody capacity |
2026 planning considerations |
Fleet expansion is generally evaluated through payload, range, fuel efficiency, aircraft age, and network flexibility. |
Source note: Global demand, capacity, load-factor, and international-growth figures are based on the International Air Transport Association’s 2024 annual air-cargo market statistics. Payload figures are representative ranges for common freighter aircraft classes and are not company-specific.
Conclusion
This article presents a practical overview of the global Air Cargo Transportation industry in 2026, focusing on the key indicators that define market performance. It examines international cargo tonne-kilometres, available cargo tonne-kilometres, industry revenue, and freighter fleet development. The ranking methodology considers cargo capacity, network reach, fleet size, operational consistency, schedule reliability, and the ability to serve major trade routes efficiently.
The analysis compares large-scale integrated logistics operators with leading cargo airlines and specialized freighter providers, highlighting how each group contributes to global supply chain connectivity. It also discusses fleet expansion, capacity planning, digital tracking, airport infrastructure, and service resilience. By combining operational data with network and reliability factors, the article offers a balanced view of the companies shaping the future of worldwide air freight without focusing solely on company size or revenue.